Addressing Slow Play And The Distance Debate. No Arm Twisting Or Earth Moving Required. Just Science: GATHER WHITE PAPER #4
Slow play and the distance debate. If you’ve ever thought these two issues were contradictory, you’re not alone.
So, what is the relationship between the pace that golfers play, and the ever-increasing course length designed for ever-increasing driving distances?
And what if a solution to both issues was right under our nose the whole time?
Or rather, in our back pockets…
MALE GOLFERS
Slow play isn’t specifically a male golfer issue, but this paper will focus on just them (we will circle back to women golfers soon). It is fair to say, however, that the distance debate is primarily about the men’s game. Golf course design that accommodates longer driving distances has men, not women golfers in mind. Consequently, in this white paper we will investigate the behaviours of male golfers and address these four questions.
How long does it take male golfers to play 18 holes?
What factors contribute to pace-of-play?
How is the golf industry addressing pace-of-play?
What is the golf industry missing?
Question 1:
How long does it take male golfers to play 18 holes?
We could make an educated guess, but we don’t need to. That’s because we have Hole19 data.
We used one day’s data – 20,000 rounds of golf – to quantify the pace-of-play question.
Hole19 is a game-enhancing smartphone app used by over 2.9 million golfers of all levels worldwide. It has recorded 30+ million rounds of golf to date. The Hole19 app provides GPS yardages, distance tracking, performance analysis, scoring functions and live leaderboards. For the purposes of this paper, Hole19 can also tell us how long golfers take to play 18 holes with real-time data.
We limited our analysis to three geographical regions.
Why? Quite simply, North America, Europe, and Great Britain & Ireland gave us the largest sample sizes for analysis and comparison. Large sample sizes are important because they smooth out the variations that can make rounds take more or less time. For example, with a large sample there will be enough golfers in each region playing as singles, twosomes, threesomes, or foursomes that it all evens out. Equally, a large sample size takes care of different weather and course conditions. If some players in the sample get stuck behind a slow group, other players will have a free run.
Quite simply, large sample sizes mean everything comes out in the wash.
That said, let’s get to the point. How long does it take male golfers to play 18 holes? Here are the regional averages:
*An interesting side note. The R&A conducted a pace-of-play study in which golfers self-reported how long it took them to complete 18 holes. Comparing the same geographical regions, golfers in the R&A study reported an average time of 10 minutes faster than the Hole19 measurement.
Question 2:
What factors contribute to pace-of-play?
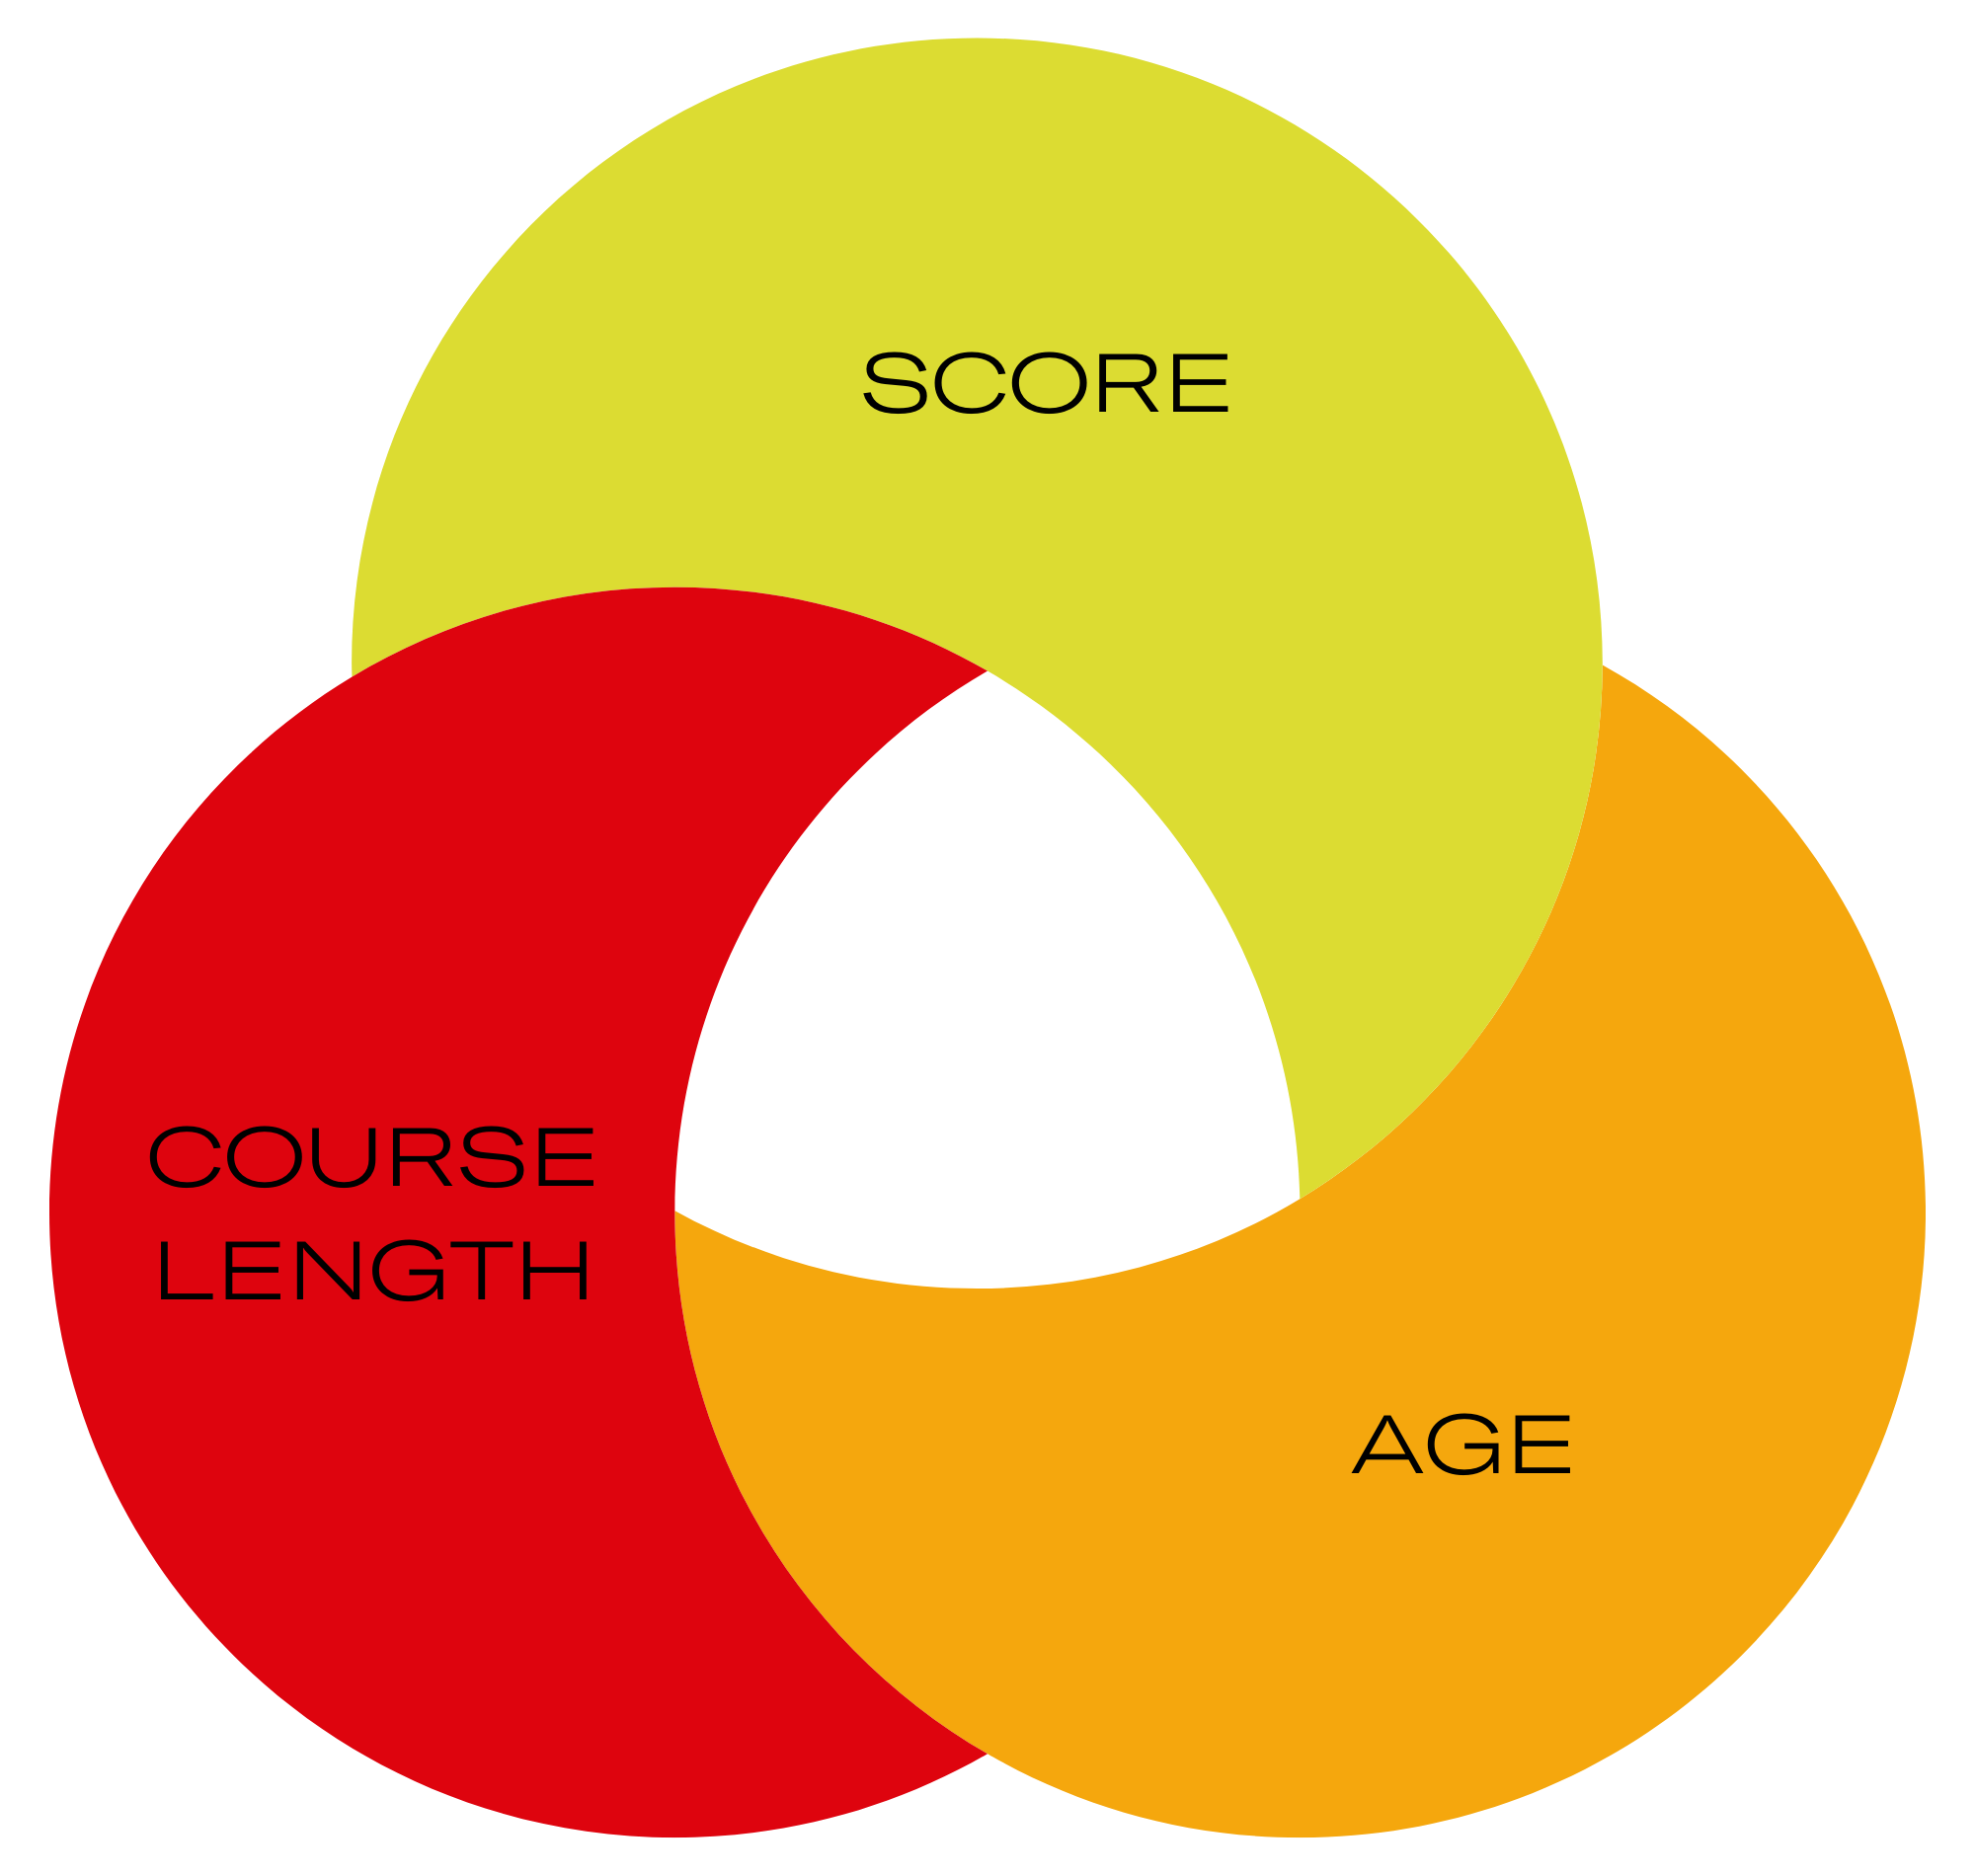
From the Hole19 dataset, we identified three factors that predicted golfers’ pace-of-play.
1
Golfers’ score. Perhaps most obviously, for each additional shot golfers hit, their pace of play slowed. By how much depended on the region. Each additional shot hit by a golfer in North America slowed the round down more than it did for European and Great Britain & Ireland players.
2
Age. Age slowed players down in some regions more than others. In Europe, players’ age did not predict their pace-of-play. In North America and Great Britain & Ireland it did. The North America finding is interesting considering the proliferation of golf carts there.
*Another note. Hole19 players were younger than those represented in the R&A sample. This means that when players self-reported their pace-of-play, they probably underestimated it more than we initially thought.
Both score and age are beyond the control of golf course operators and administrators.
So, if we want to speed up pace-of-play we need to dig deeper into the data and look for factors that we can influence.
Further analysis of Hole19 data required controlling for score and age. For non-statisticians, this means we tested other variables that contribute to slow play beyond score and age. When we did that, one more factor emerged. Course length.
3
Course length. In all three geographical regions there was an obvious trend. As courses got longer, it took players statistically longer to play it.
Let’s state the obvious again. The longer the course, the slower golfers played.
Although the average course length in Europe (6,239 yards), Great Britain & Ireland (6,004 yards), and North America (6,109 yards) varied, its length was a factor that contributed to the pace-of-play.
Considering this finding, if golf course operators want to speed up play, they need to get male golfers playing shorter courses.
How to effectively do that? Keep reading. After reviewing current strategies, we have a novel solution.
Question 3: How is the golf industry addressing pace-of-play?
Unfortunately for us all, golf course operators cannot make us younger. They cannot wave a magic wand and reduce our scores either. So, the only tool in their toolbox is reducing the yardage that golfers play. Course lengths, however, are trending the wrong way considering the relationship between yardage and pace-of-play. The USGA’s Distance Insights Project reported that in the last 100 years, golf courses have increased in length by approximately 5 yards a year. And according to the USGA:
“We believe that this overall trend towards longer courses is likely to continue if hitting distances continue to increase.”
As golf courses become longer and pace-of-play slows down, golf course operators encourage players to move up a set of tees. Tee it Forward. The Long Leaf Tee System. Genderless tees. Building new tee boxes. All these initiatives are good, but beyond anything else, they rely on golfers selecting tee boxes based on their estimated driving distance.
And golfers don’t do this well.
The Elephant in the room.
There is one additional problem with these initiatives designed to encourage male golfers to play shorter courses and subsequently speed up play.
That is, the forward tee is still perceived as the women’s tee.
This could be because of its colour, its name, or something else. But it discourages male golfers from teeing it up there.
What if behavioural science can help the golf industry navigate this dilemma? We think it can.
Question 4: What is the golf industry missing in this debate?
“ITSS” (It’s the scorecard, stupid).
Researchers have demonstrated that how information is displayed affects how people interact with it. Male golfers are no exception. This means that the golf industry can nudge male golfers to play a shorter yardage by redesigning the scorecard.
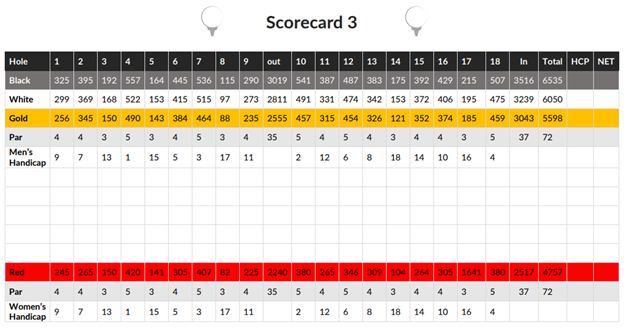
Gather conducted a study with over 350 male golfers based in the USA. They were presented with three different scorecards and were asked the likelihood of playing from each tee listed. All scorecards had four sets of tees. The yardage options were the same on each scorecard. But the scorecard was designed differently in each of the three iterations.
Tee #1: 4757 yards
Tee #2: 5598 yards
Tee #3: 6050 yards
Tee #4: 6535 yards
Scorecard 1: Neither traditional colour of tees or gender were represented on the scorecard’s list of tees. All tee options were presented in the same block with the same grey colour.
Scorecard 2: Tee options were presented in the same block, but tees had traditional names and colours associated with them. Black was used for the longest teeing option, and red for the shortest.
Scorecard 3: Tees had traditional colours associated with them. Black was used for the longest teeing option, and red for the shortest. In addition, the most forward option was separated from the others which suggested that they were the de facto women’s tees.
How scorecard design changes tee choice.
Given the same yardages, on the same course, with the same number of tee options, scorecard design made a significant difference to the tees male golfers indicated they would choose. They said they were more likely to play from the most forward tee when they were presented with Scorecard 1 rather than Scorecard 3. They also indicated that they were more likely to play from the second shortest tees given the same options. (The scorecard design did not significantly change the likelihood of male golfers choosing to play from tee #3 or tee #4.)
This is an unbelievable finding.
By knowing how much course yardage impacts pace-of-play, this means if golfers moved up a tee box on the hypothetical course used in this study it would speed up play by 7-14 minutes per round.
Recognizing the contradiction of the slow play and distance debates.
There is an inverse relationship between course length and pace-of-play.
As you solve one issue, the other gets worse.
This means that as the golf industry addresses equipment advances with longer courses, the other pain point – pace-of-play – gets slower. But if course length is the industry’s most controllable factor for speeding up play, a good solution would be pushing recreational male players onto more forward tees. And this is when scorecard design becomes valuable. By integrating behavioural science into scorecard design, golf facilities could nudge players towards forward tees and speed up play.
No arm twisting or earth moving required. Just science.
THREE takeaways…
Evaluate your scorecards. How does the current scorecard design influence players and their tee selection?
How would you redesign your scorecards if you want more male golfers to play shorter tees?
Consideration…Do you want to test how scorecard design influences pace-of-play at your facility?
If so, contact us.
#makebetterdecisions
QUESTIONS?
ASK US ANYTHING!
Also, you might want to check out the lovely Team over at Hole19 who helped us with data.
VALUABLE?
We would love to know what you think about your Gather White Paper #4 !
Tell us in just 1 minute: Did Gather White Paper #4 offer any value to you and your own business practice?


